The way to a traveler’s heart is through their stomach: A culinary ranking of European cities
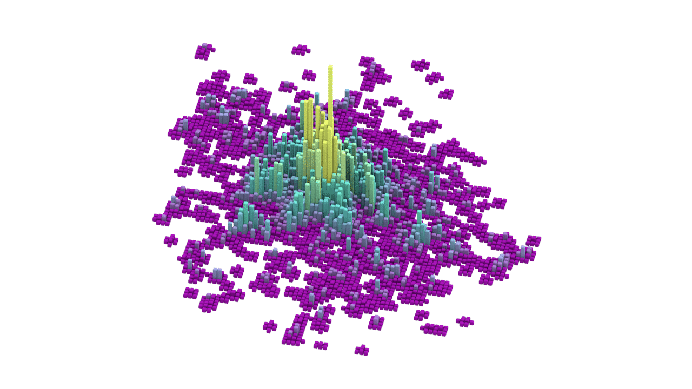
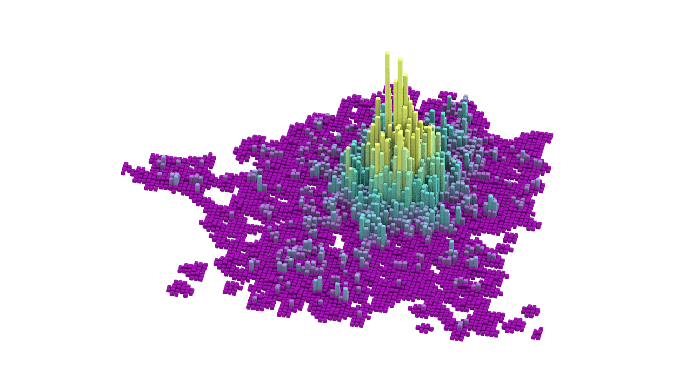
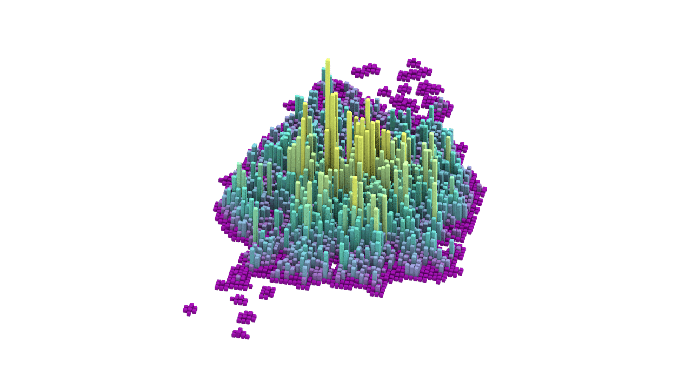
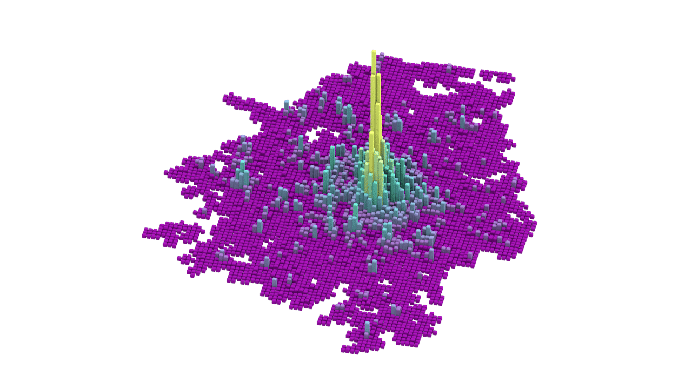
For travelers, food can make or break a city; the more culinary options there are in a city, the more enticing a destination it will be among tourists and expats. Toward this end, our team of analysts have conducted a survey on food outlet penetration across major European cities, taking into account the housing prices and quality-of-life rankings. Among the findings were that while Vienna has the most food outlets per capita, London has far and away the most food outlets in absolute terms.
.jpg)
Methodology
Through a detailed analysis of real estate investment prospects in several major European metropolises, we narrowed our survey down to 11 cities in different parts of Europe: Paris, Rome, Barcelona, Prague, Budapest, Berlin, Munich, London, Vienna, Moscow and St. Petersburg.
We then counted the number of cafés, restaurants, bars, pubs, fast-food outlets, and food courts by referring to data obtained from OpenStreetMap (OSM) API as of October 2020.
European urban areas are dynamic and do not end within administrative boundaries. With the spread of urban lifestyles and the development of the transport frame, the suburbs around cities become an integral part of them and act as outer areas with high population densities. In contemporary research, therefore, city boundaries can be distinguished in different ways, which often leads to different interpretations. To bring the size of the considered cities to comparable areas in the case of compact Paris and Barcelona, we took the territories of urban areas: Greater Paris (Métropole du Grand Paris) and Greater Barcelona (Àrea Metropolitana de Barcelona). London was considered within the boundaries of Greater London.
It bears noting that the borders of some major cities have shifted in recent years. Moscow, for instance, expanded its official borders in 2012, thereby increasing its raw size by 2.5 times, and boosting its population significantly. Despite this expansion, most establishments remained concentrated in the city center. For purposes of this study, we referred to the pre-2012 Moscow borders, as has been the tendency in comparable studies in recent years.
We focused on food outlet penetration in assessing the attractiveness of these European cities. We also considered the number of food outlets per square meter, the market share percentages of various types of market penetration, and ranked each parameter.
We considered our findings in comparison with average home purchase prices and cost per square metre of rental space. In so doing, we referenced reports released by Deloitte and Mercer.
“We wanted to analyse the appeal of European cities for international buyers looking to acquire buy-to-rent properties,” says Elena Skrebkova who led the research project, “Food outlet penetration in a location is one of the key parameters indicating the overall quality of the urban environment and the social and economic activity of the population.”
The survey focuses on pre-pandemic market potential and the penetration of food outlets by type without reference to food and beverage industry closures. We anticipate that while the COVID pandemic will negatively impact the total number of food outlets, demand and penetration by type will remain stable.
Top 5 food & beverage cities in Europe: Vienna, Prague, Munich, Berlin, Budapest
Vienna has the largest number of food outlets per capita, with 518 cafés, bars, and restaurants per 100,000 people. That said, its real estate proved to be one of the most affordable city in the sampling, with an average purchase price per square metre of housing at €4,900.
Prague ranked second with 504 food outlets per 100,000 people, followed by Munich (438). Berlin is in fourth place with almost the same figure (435), while Budapest with 342 cafés, restaurants and bars per 100 thousand inhabitants rounds out the top five. Budapest is one of the most affordable cities to buy an apartment, second only to Saint Petersburg.
Russia’s two most densely populated cities, St. Petersburg and Moscow, fell to the bottom of the ranking, coming in 10th and 11th place, respectively. See below for the full list of cities we considered.
Cities by number of food outlets per 100,000 people
City | Food outlets per 100,000 people (in units) | Absolute number of food outlets (in units) | Population size as of 1 January 2020, people (source: ec.europa.eu) | Population density (people per per sq. km) | City area (sq. km) | |
|---|---|---|---|---|---|---|
1 | Vienna | 518 | 9,958 | 1,921,153 | 4,629 | 415 |
2 | Prague | 504 | 6,680 | 1,324,277 | 2,670 | 496 |
3 | Munich | 438 | 6,503 | 1,484,226 | 4,788 | 310 |
4 | Berlin | 435 | 15,977 | 3,669,491 | 4,118 | 891 |
5 | Budapest | 342 | 5,996 | 1,752,286 | 3,338 | 525 |
6 | Paris (Greater Paris) | 274 | 19,359 | 7,075,028 | 8,692 | 814 |
7 | Barcelona (Metropolitan area) | 252 | 8,150 | 3,239,337 | 5,093 | 636 |
8 | Rome | 248 | 7,076 | 2,848,084 | 2,213 | 1,287 |
9 | London (Greater London) | 232 | 20,835 | 8,961,989 | 5,712 | 1,569 |
10 | Saint Petersburg | 157 | 8,471 | 5,398,064 | 3,751 | 1,439 |
11 | Moscow | 101 | 12,452 | 12,273,097 | 11,353 | 1,081 |
London came in first in terms of the absolute number of food outlets
Interestingly, London has by far the largest absolute number of food outlets: almost 21,000 cafés, restaurants, bars, pubs, fast food outlets, and food courts. It bears noting, however, that London is the largest city included in our survey, and its population is 4,7 times that of the ranking leader Vienna, trailing in our survey only behind only Moscow in populousness.For this reason, London does not occupy a high position in our ranking, which focuses on food outlet penetration per capita.
As seen in the table above, Paris has the second biggest number of restaurants after London, and comes first by the largest number of food outlets per capita among cities with over 5 million inhabitants.
Berlin ranks third in terms of the total number of food outlets, followed by Moscow. Moscow, which has a relatively large area and is the most populous city in the ranking, claims last place with respect to food outlet penetration per capita.
Food outlet penetration: distribution of outlet types within city borders
The locations of food outlets within a city and their proximity to people residing on the outskirts are worth noting alongside with the number of food outlets. Most cities in our survey are monocentric, and their food outlets are primarily amassed in their historic centres, and only thinly scattered across the outer districts.
Paris is a notable exception, with 20 arrondissements (districts) that are unique microcosms, each with its own signature atmosphere and culinary options. The French capital is both polycentric and the center of a bigger agglomeration Greater Paris, giving residents and visitors a sense of community and enabling them to discover a diverse array of cuisines. If we took into account only Inner Paris (area of 105 sq. km), it would have come first in the ranking, with more than 700 food outlets per 100,000 people. Nonetheless, it wouldn’t be comparable with the other cities in the sample.
Food outlet penetration by types in the comparative sampling
We found that the cities we reviewed varied in terms of the type of foot outlet their inhabitants favored.
In Paris, Barcelona, and Vienna, restaurants accounted for the majority of food outlets. Paris truly is a haute cuisine capital, boasting more than 9,000 restaurants, 121 of which have received Michelin stars.
In London, where it is common to convene with friends over a pint, pubs account for 17% of the total food and beverage market. In Barcelona, where wine tends to be the drink of choice, pubs account for only 2%, while bars account for 18%. Rome ranks second in the sampling for bar penetration with one in ten outlets here being a bar. The deepest market penetration of pubs is in Budapest — 18%.
The cities with the lowest overall numbers of pubs and bars in our ranking are Vienna and -- stereotypes aside -- Moscow, where alcoholic beverage establishments account for just 9% of the market share.
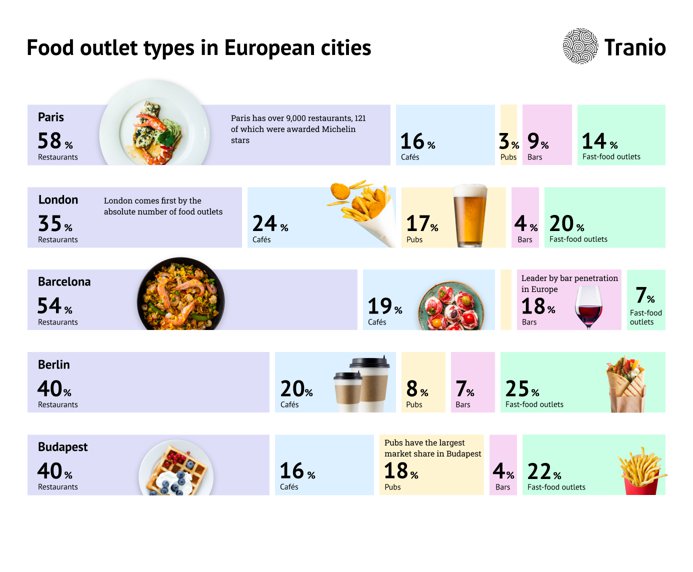
In Moscow and Saint Petersburg, restaurants and fast food outlets accounted for roughly equal market shares. Moscow boasts the largest number of McDonalds (186) among the cities we analysed, outpacing London, which has 157.
Penetration of food outlet types in cities of Europe (%)
Cafés | Restaurants | Bars | Pubs | Fast-food outlets | Total food outlets | McDonald's restaurants | |
|---|---|---|---|---|---|---|---|
London | 24% | 35% | 4% | 17% | 20% | 20,835 | 157 |
Paris | 16% | 58% | 9% | 3% | 14% | 19,359 | 72 |
Berlin | 20% | 40% | 7% | 8% | 25% | 15,977 | 78 |
Moscow | 37% | 27% | 5% | 4% | 27% | 12,452 | 186 |
Vienna | 17% | 53% | 5% | 4% | 21% | 9,958 | 51 |
Saint Petersburg | 38% | 23% | 7% | 3% | 28% | 8,471 | 78 |
Barcelona | 19% | 54% | 18% | 2% | 7% | 8,158 | 48 |
Rome | 28% | 48% | 10% | 3% | 11% | 7,076 | 59 |
Prague | 15% | 52% | 8% | 8% | 17% | 6,680 | 43 |
Munich | 16% | 53% | 5% | 6% | 20% | 6,503 | 60 |
Budapest | 16% | 40% | 4% | 18% | 22% | 5,996 | 35 |
Berlin, Saint Petersburg, and Vienna have the most affordable housing prices
Vienna, Munich and Berlin are the most comfortable cities to live in of those included in our survey, according to the latest available Mercer quality of life report, which considers political stability, economic and environmental factors, personal safety, healthcare, education and more. However, Munich ranks second by the housing price per square metre and its real estate market is considered overheated.
Vienna in addition to be the first in terms of food outlet penetration has relatively low housing prices per square metre and rental rates.
Cities ranked by home rental rates
City | Rent per square metre, euro, Deloitte | Average Transaction Price of a New Dwelling (EUR/sqm), Deloitte | Quality of living rank by Mercer | Food outlet penetration rank by Tranio | |
|---|---|---|---|---|---|
1 | Berlin | 9.1 | 5,478 | 13 | 4 |
2 | Saint Petersburg | 9.7 | 1,460 | 174 | 10 |
3 | Vienna | 9,9 | 4,868 | 1 | 1 |
4 | Budapest | 11,6 | 2,107 | 76 | 5 |
5 | Prague | 9,3 | 3,395 | 69 | 2 |
6 | Rome | 13.3 | 3,259 | 56 | 8 |
7 | Moscow | 14.6 | 2,270 | 167 | 11 |
8 | Munich | 16.4 | 8,250 | 3 | 3 |
9 | Barcelona | 19.3 | 5,763 | 43 | 7 |
10 | London | 27 | 7,699 | 41 | 9 |
11 | Paris | 28.3 | 12,863 | 39 | 6 |
While on one hand Berlin boasts some of the lowest rental rates in Europe, it can also be very difficult in practice to find decent apartments for rent given the city’s extremely high demand. This is attributable to rental caps imposed in February 2020, which applied to the city’s historic homes. Nonetheless, in April 2021 the rent cap in Berlin was overturned by Germany's top court, which could lead to a change in the average rent in the German capital. The city’s food outlet density ranks fourth per capita.
Saint Petersburg ranks second by rental rates, but falls behind on food outlet penetration, as well as in Mercer’s quality of life ranking.
Key takeaways
Vienna takes the cake when it comes to food outlets per capita. It is also proved to be one of the most affordable city in the sampling.
The study found that the casual eater does not necessarily have to go to expensive Paris or London, although they have the largest selection of cafés and restaurants. Nevertheless, Vienna, Prague, Munich, Berlin and Budapest were the leading destinations in terms of per capita availability of dining establishments. Being relatively small tourist centres, they are better endowed with adequate infrastructure. In addition, all of them, with the exception of Munich, are among the most affordable European cities in terms of price per square metre.
Although Paris has the most Michelin-starred restaurants and the second highest food outlets number, housing prices there are relatively high for buyers and renters alike.
London has the highest absolute number of food outlets, but also boasts sky-high housing prices.
More than half of the establishments in Paris, Vienna, Barcelona, Prague and Munich are restaurants, while Russian cities have the highest share of fast food outlets.
What an expert thinks
Kirill Puzanov, Associate Professor, Head of the Vysokovsky Graduate School of Urbanism (HSE)
"City rankings are always tricky because of two main problems to solve: within what boundaries to explore a city and how to measure the indicator of interest. Here, an interesting attempt is made to deal with the first question. As for the number of restaurants and cafés, there are limitations to the data itself. In an ideal world, it would be better to analyse the number of seats rather than the number of cafés themselves, because the word ‘restaurant’ in different countries can mean a banquet hall for dozens of people or a small family-run establishment. Nevertheless, the results of this study do lead to some interesting insights:
- The larger the city, the harder it is to get to the top positions. Why is this the case? Perhaps it is a consequence of extensive urban planning policies. The suburbs of Paris, London and Moscow kill all the potential that their centre bears. I assume that if the centres were analysed separately, the largest cities would be at the top of the rankings.
- Restaurants as a legacy of bygone eras. Many restaurants and cafés, or the environment in which they were originally formed, might have appeared in times of a different country, different financial flows and a different culture.
- Going to a cafe as an outlet or as an everyday practice. Going to a restaurant may be an event for people in Moscow, but in Barcelona it is an everyday norm. And vice versa, cooking at home can be an everyday occurrence for some cultures, but for others it is an event on big holidays, when the whole family gathers.
I think this ranking could be the beginning of a good research paper looking at the patterns of the restaurant business, restaurant culture and consumption practices of the urban space as a whole.”
Authors: Elena Skrebkova, Marina Safronova
Infographics: Elena Skrebkova, Alina Atamanenko
We will send you a content digest not more than once a week