The dynamics of cross-border transfers from Russia
According to official individual cross-border transfer statistics published by the Russian Central Bank, in the 12 years between 2006 and 2011, $479 billion (or $519 billion, adjusted for inflation) were transferred from Russia to 257 foreign countries and territories. This figure amounts to 2.4% of Russia’s GDP during the same period.
Between 2006 and 2017, Russian individuals transferred $519 billion (adjusted for inflation) or 2.4% of Russia’s GDP to foreign countries.
Cross-border transfers from Russia between 2006 and 2017 saw linear growth, with an average annual increase in the volume of transfers of $1.8 billion (4.1% of the annual average for the period). The maximum annual volume was reached in 2014 and amounted to $69 billion in current prices ($72 billion adjusted for inflation), or 1.7 times higher than the average.
However, the dynamics of capital withdrawal are uneven: three periods of progressive growth interrupted by two sharp declines due to the 2008 and 2014 crises can be observed.
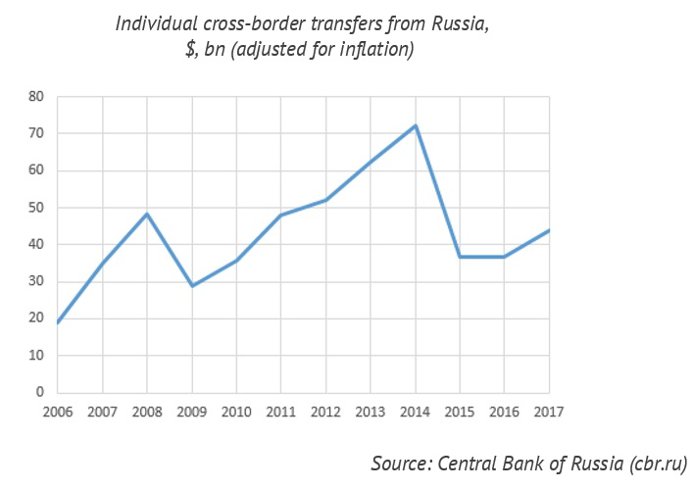
Capital withdrawal from Russia between 2006 and 2017 saw linear growth, interrupted by the 2008 and 2014 crises.
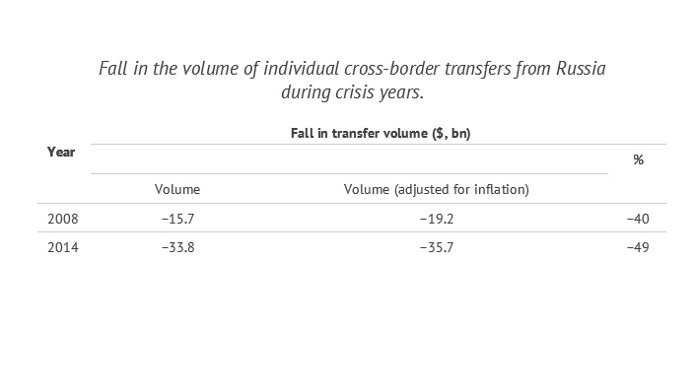
The 2014 financial crisis hit the Russian economy and cross-border transfers harder than the 2008 crisis. In 2014, the decline was approximately twice sharper than in 2008.
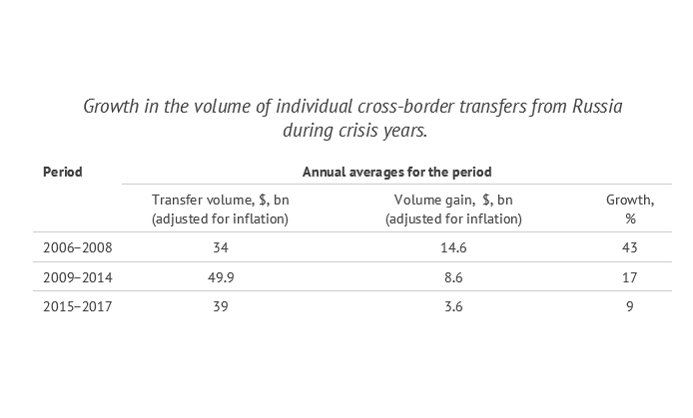
Between the crises, capital withdrawal volumes increased progressively, though growth rates slowed after each decline.
In 2017, the total transfer volume reached $43.8 billion, which only slightly exceeds the annual average since 2006 ($43.2 billion). This figure is 1.6 times lower than the all-time high reached in 2014.
After the 2008 and 2014 crises, cross-border transfers grew but their growth rates were significantly lower than before the crises.
Notably, the cross-border-transfer-to-GDP ratio demonstrated similar, yet more moderate dynamics. In 2006–2017, average growth rates accounted for 3.8% of the annual average.
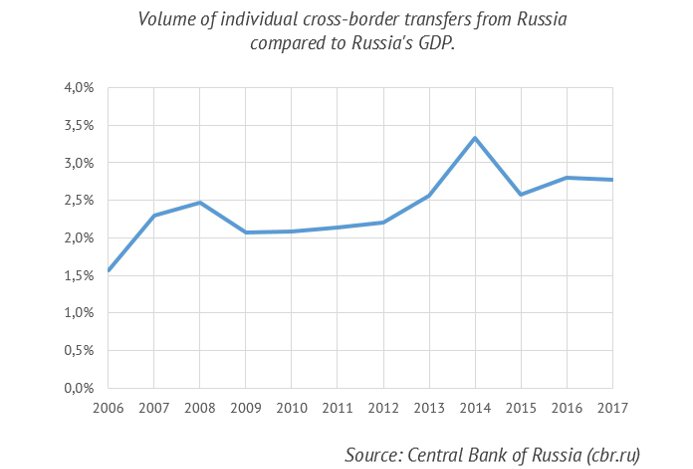
The coefficient of correlation between the volume of capital withdrawn and Russia's GDP is 0.84, which is statistically significant at the 99% level of confidence. Tranio analysts posit that the growing capital outflow was one of the reasons for Russia’s 2014 crisis.
The higher are the volumes of transfers from Russia (in absolute terms), the larger share of Russia's GDP they account for.
Russian capital transfers to the far abroad
According to the Russian Central Bank, between 2006 and 2017, individuals transferred $318 billion ($344 billion adjusted for inflation) from Russia to far-abroad countries (countries outside the Community of Independent States), which account for 66% of the total cross-border transfer volume.
The dynamics of transfers to far-abroad countries made over the past 12 years do not have any statistically significant differences compared to the dynamics across all the countries; conversely, the coefficient of correlation between the two ranges is 0.98.
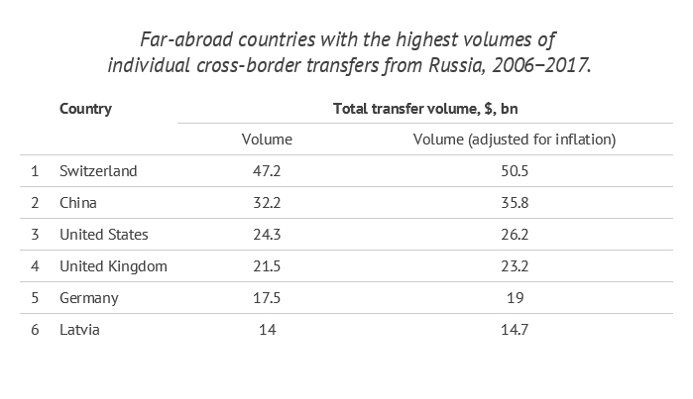
Six countries account for half of the total amount transferred to the far abroad:
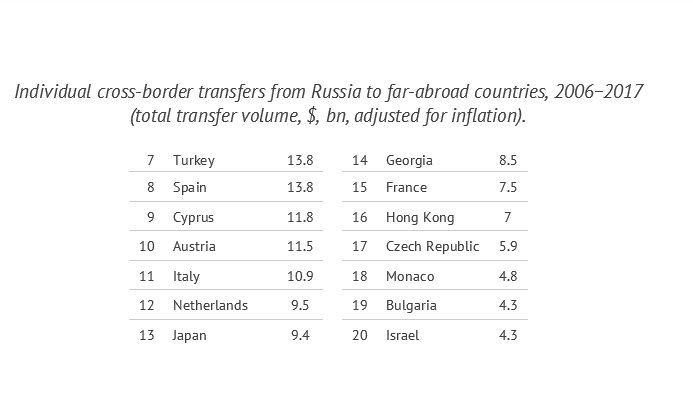
The following countries make the top 20 in terms of transfer volume:
Six countries − Switzerland, China, the United States, the United Kingdom, Germany and Latvia − account for half of the total amount transferred by individuals from Russia to the far abroad between 2006 and 2017.
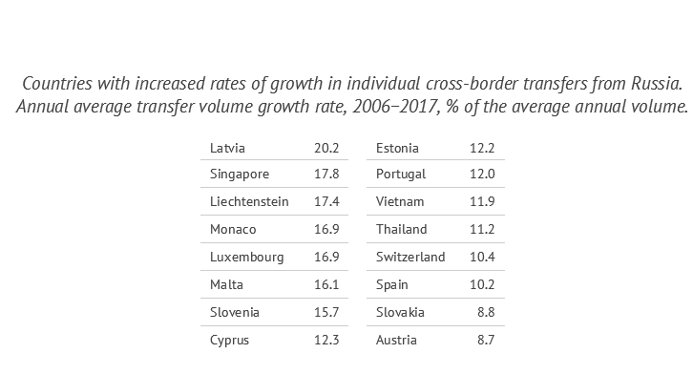
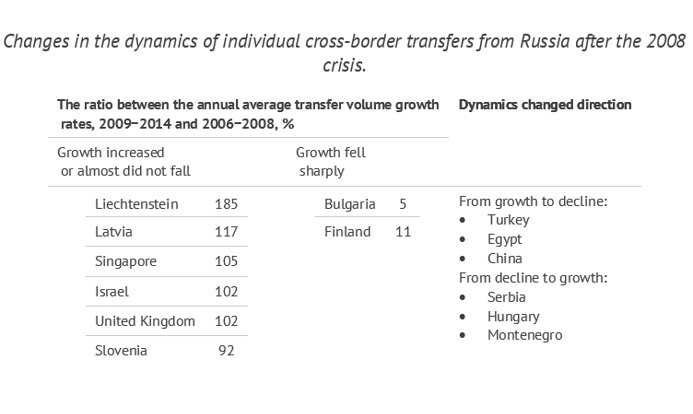
As for the dynamics of transfers to the most significant countries (each of which accounts for at least ¹⁄₁₀₀₀ of the total amount; there are 65), the average rate of growth in the volume of transfers to certain countries exceeds the average (4.1%) by more than twice:
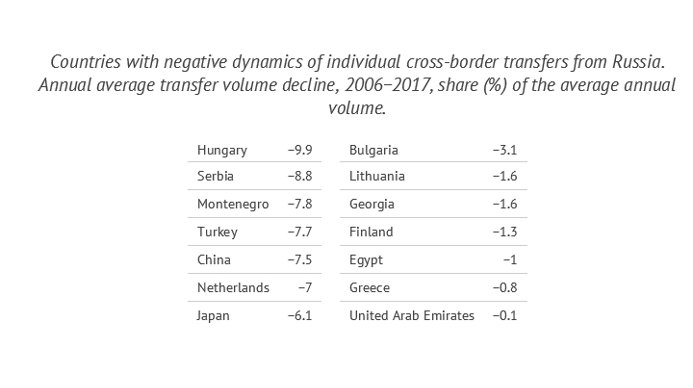
There are also countries with negative dynamics, where falling transfer volumes was observed between 2006 to 2017:
The annual average transfer volume fluctuation (the average between the absolute difference values of the nearest years) shows how smooth transfer volume changes were, regardless of whether they were positive or negative. The worldwide annual average fluctuation over the same period was 30.3%, but certain countries demonstrated extremely uneven dynamics. At the other end of the scale, five countries had the "shallowest" dynamics.
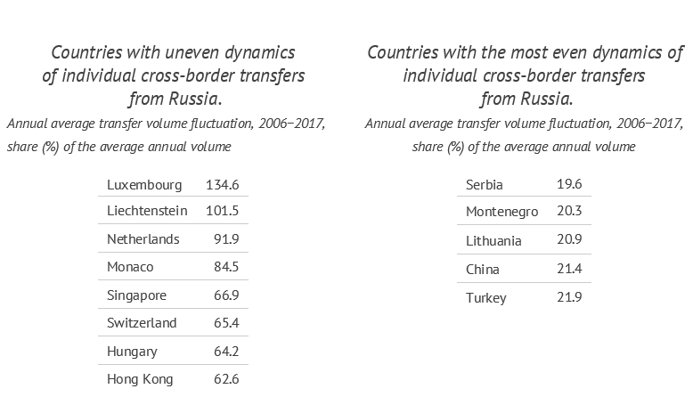
Dynamics stability is the number of times the annual volume changed from negative to positive and vice versa during the period observed. Globally, transfer volume dynamics "changed direction" four times from 2006 to 2017 due to crises: from growth to decline in 2009, from decline to growth in 2010 and similarly in 2014–2015.
However, dynamics for three countries — Hungary, China and Malta — changed direction seven times, or almost annually, which means that transfer dynamics were extremely unstable. In addition, 11 countries – Croatia, Greece, Egypt, Ireland, Liechtenstein, Lithuania, Luxembourg, Monaco, Netherlands, Switzerland and the UAE – "changed direction" six times.
Countries with the highest transfer volumes have transfer dynamics that reflect global trends; strong fluctuations more often characterise the countries outside the top 20. However, exceptions also exist: Switzerland, which ranks first, has high growth rates but also extremely uneven changes in transfer amounts from year to year, while China (which ranks second) is characterised by negative and very "shallow" dynamics.
The nature of the dynamics of transfers from Russia to most countries with the highest 2006−2017 transfer volumes is similar to the nature of the worldwide dynamics. The individual characteristics of dynamics are common for the countries outside the Top-20 in transfer volume.
The dynamics of cross-border transfers during the periods of growth
During each of the three periods between crises, the rankings of countries with the highest volumes of transfers were significantly different:
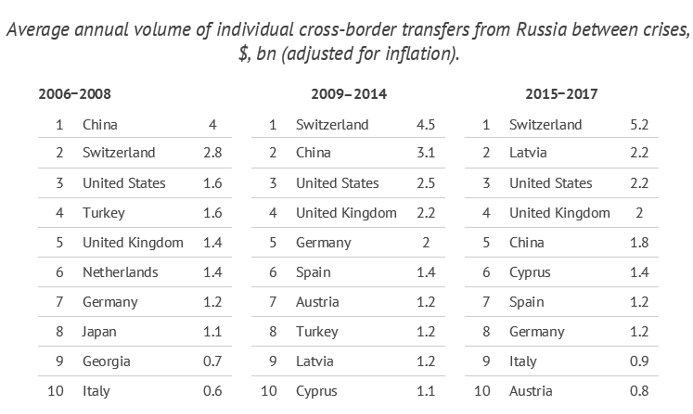
Only five countries – Switzerland, China, the United States, the United Kingdom and Germany – remained the top 10 from 2006 to 2017.
During each period there were also countries with transfer volume growth significantly exceeding the global average and countries with negative dynamics amid general growth:
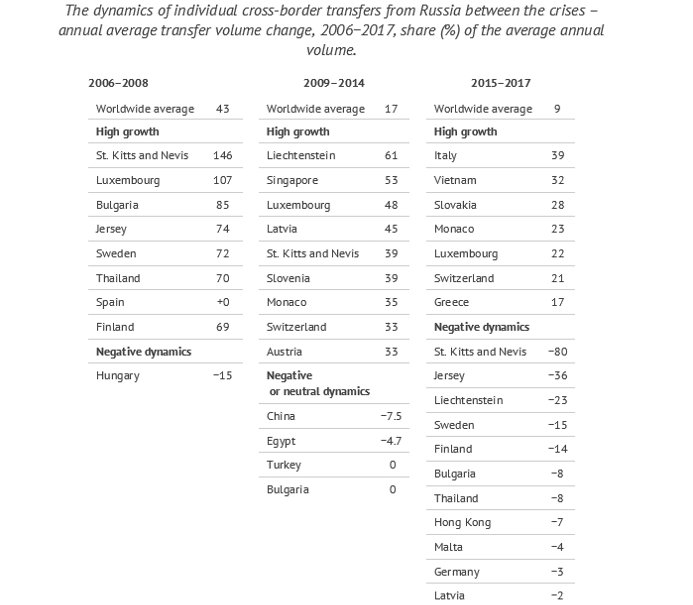
Among countries that account for at least ¹⁄₁₀₀₀ of the total transfer volume, only Luxembourg had increased rates of growth in all three periods between the crises, although they gradually approached the global average. Countries that "soared" before the 2008 or 2014 crisis typically have negative dynamics since 2015. This is typical of both offshore financial centres (St. Kitts and Nevis, Jersey) and large countries in different parts of the world (Bulgaria, Finland, Thailand).
Among the top 10 countries in terms of transfer volume from 2006 to 2017, Germany and Latvia, whose volumes instead fell in 2015−2017, are worth paying attention to.
Most countries that had increased rates of growth of transfers from Russia before the 2008 and 2014 crises demonstrated negative dynamics in 2015−2017.
Cross-border transfers during the 2008 and 2014 crises
Certain countries had a sudden change in transfer volumes from Russia between 2008 and 2009 that differed significantly from global average:
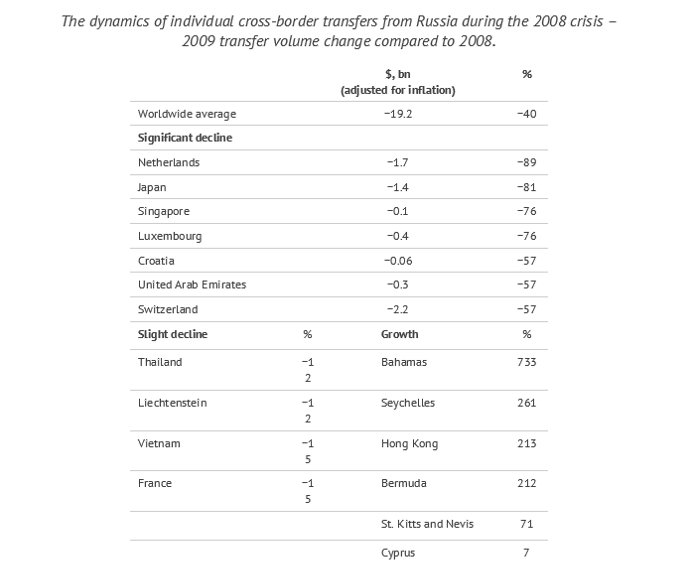
As a result of the 2008 economic crisis, transfer volumes to certain countries "sagged" very slightly, while the flow of transfers to others grew. Hong Kong, which received about $7 billion in 2009 – almost $400 million more than in 2008 (adjusted for inflation) – was the leader in absolute annual transfer growth. Cyprus was second, with $38 million more than 2008.
In percentage correlation, the volumes of transfers during the crises most notably grew in offshore financial centres. For instance, in 2009, the Bahamas received 8.3 times more capital from Russia than in 2008.
During the 2008 crisis, the volume of Russian transfers to offshore financial centres rose sharply amid general decline.
After the 2008 crisis, the rates of growth of the volume transfers to foreign countries amounted to 17% per annum or 40% of pre-crisis levels. However, in certain countries, the dynamics changed more significantly.
During the next crisis in 2014, certain countries once again showed the dynamics that were significantly different from the worldwide decline in the volume of transfers from Russia:
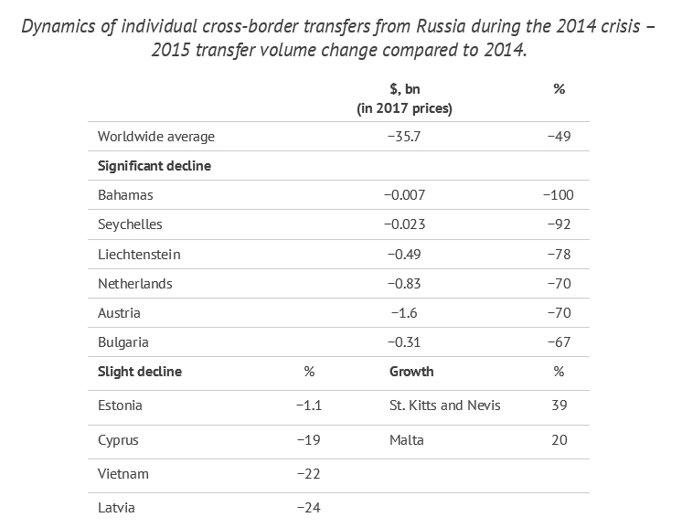
Both crises hit transfers to Switzerland and the Netherlands especially hard. Cyprus, which saw a rise in transfers to the country during the 2008 crisis "sagged" less than many other countries in 2014. The nature of cross-border transfers to offshore financial centres was radically different from the previous crisis. The offshore financial centres that experienced a steep influx of capital from Russia after 2008 conversely showed the maximum rates of decline after 2014. For example, according to the Central Bank, transfers to the Bahamas in 2009 ceased completely. However, St. Kitts and Nevis demonstrated a significant growth during both crises.
The crises of 2009 and 2014 hit cross-border transfers from Russia to Switzerland and the Netherlands especially hard.
After the 2014 crisis, the rates of growth of the volumes of transfers to foreign countries averaged approximately 9% per annum, or 54% of the pre-crisis level. However, in certain countries, the dynamics once again changed more significantly.
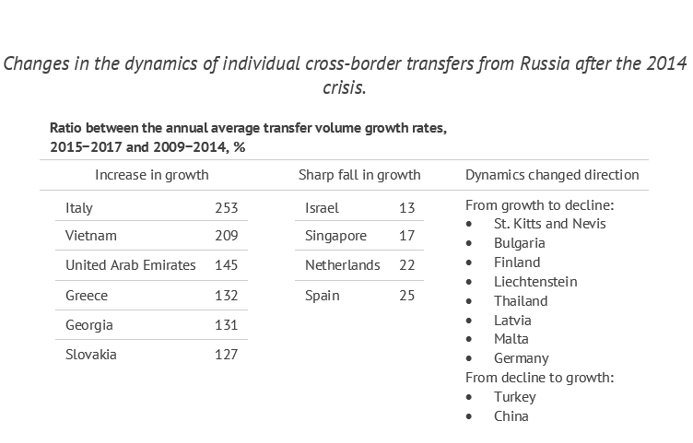
The growth of cross-border transfers from Russia to Bulgaria and Finland, which had not recovered sufficiently after the 2008 compared to worldwide dynamics, entirely moved from growth to decline after 2014. In contrast, China and Turkey, which had been demonstrating growth before 2008 and a uniform decline between 2009 and 2014, resumed growth from 2015.
Transfers from Russia to certain countries
Between 2006 and 2017, the dynamics of transfers from Russia to certain countries was especially notable.
Switzerland demonstrated the strongest growth during the whole period. The 2014 surge ($6.4 billion in 2017, 142%) is noteworthy for being almost evenly offset by the crisis a year later (-$6.8 billion). A similar shift in the dynamics was observed in neighbouring Austria a year earlier – in 2013, Austria attracted $2.5 million, which was 2.8 times more than in 2012.
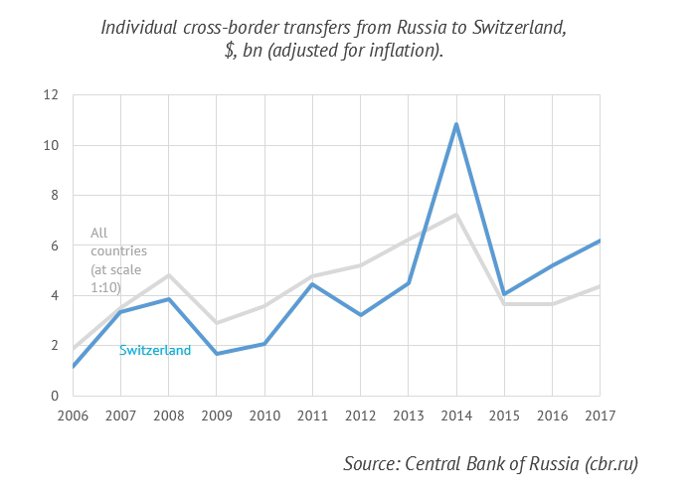
The total volume of transfers to Switzerland exceeds all the other countries significantly. The total volume of transfers between 2006 and 2017 amounted to $50.5 billion (adjusted for inflation), which is 1.4 times more than China, in second place. The volume of transfers from Russia to Switzerland alone accounted for 9.7% of the global transfer volume.
Switzerland demonstrated the biggest growth in the volumes of transfers from Russia between 2006 and 2017. The total volume of transfers to Switzerland exceeds the figures to all other countries significantly.
In 2006, China was the leader, outrunning Switzerland (which ranked second then) by 2.6 times. However, since the 2008 crisis, there was a gradual decline in the volume of transfers from Russia to China. By 2017, the country was 20th, and the volume of transfers to China was 3.3 times lower than Switzerland.
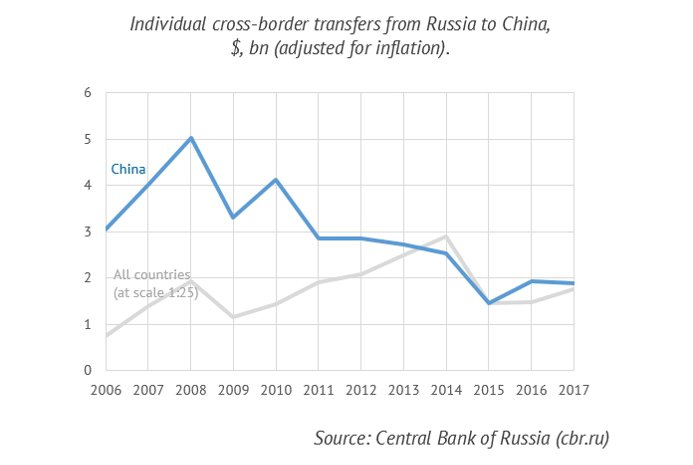
Between 2015 and 2017 the volume of transfers to China grew by an average of 12% annually, but it is still difficult to say whether this growth will be maintained into the future.
Turkey is characterised by almost the same dynamics, with a transfer volume 2.6 times lower than China.
Transfers to Latvia showed sustainable growth before 2014 and did not "sag" much during both crises. Of note is a period of rapid rise between 2012 and 2014 (60% per annum on average). However, since 2014, there has been a decline in the volume of transfers from Russia to Latvia.
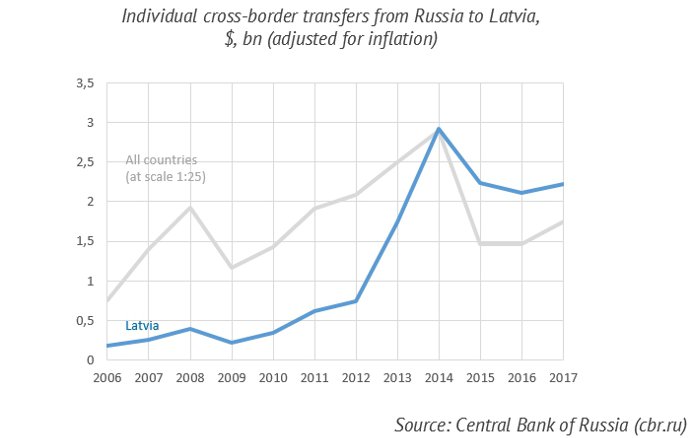
The volume of transfers from Russia to Latvia had demonstrated a sustainable growth prior to the crisis of 2014, but there was a trend towards the decline of volume after that.
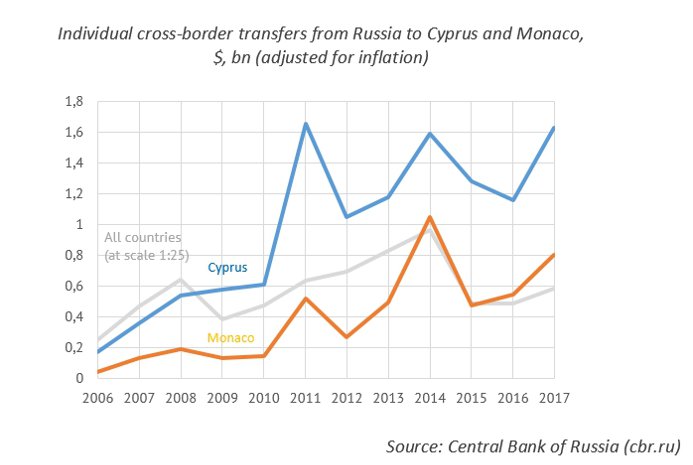
Cyprus and Monaco had almost identical transfer volume dynamics. Between 2006 and 2017 both countries demonstrated a trend towards growth, marginally affected by the crises. In 2012, both Cyprus and Monaco experienced similar transfer volumes declines (62% lower than the annual average during the whole period).
Cross-border expenses on real estate transactions
The Russian Central Bank has been providing real estate transaction statistics since 2009, and the data only concerns individual transfers made by Russian residents. The dynamics of transfer to far-abroad countries made over the past 12 years do not have any statistically significant differences compared to the dynamics of all individual transfers; conversely, the coefficient of correlation between the two ranges is 0.99. Therefore, the formal division of individuals into residents and non-residents of Russia does not lead to qualitative differences in cross-border transfer statistics for these groups of taxpayers.
Central Bank statistics on cross-border transfers from Russia do not reveal any qualitative differences between the country's residents and non-residents.
Between 2009 and 2017, the total volume of expenses on cross-border real estate transactions among Russian residents was $13.4 billion (adjusted for inflation), or $1.5 billion per annum. It accounts for 4.8% of the volume of all transfers made by residents for all types of purposes and 3.2% of the total volume of transfers by Russian individuals during the same period.
The Central Bank does not provide statistics on cross-border expenses related to real estate transactions by country, for which reason only the summarised global data is considered. The dynamics of cross-border transfers fluctuates widely.
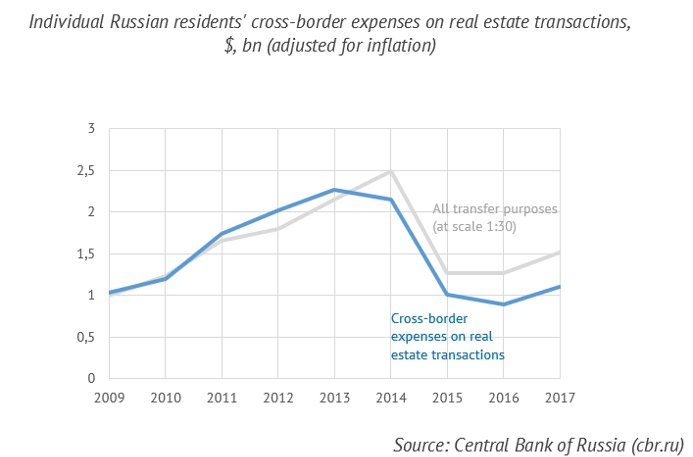
Starting from $1.03 billion (adjusted for inflation) in 2009, transfer volumes grew exponentially till 2011, resuming linear growth and reaching a maximum of $2.27 billion in 2013. The annual average rate during this growth (20%) is slightly higher than for all cross-border transfers during the same period (18%).
After 2013, a decline began, and the transfer volume reached a low of $0.89 billion in 2016. During this period, the transfer volume fell by 61% against the maximum level which, again, exceeds the total decline in the volume of transfers from Russia during the crisis (-49%). Only in 2017 did it rise to $1.1 billion, exceeding the 2009 figure by only 6%. At the same time, the annual transfer volume grew by 23% in 2017, which, again, exceeds the growth from the year before (19%).
The volume of cross-border expenses related to property transactions of Russian individuals both grow and fall slightly sharper than cross-border transfers in general.
However, the share of property-related transfers in total cross-border transfers shows a clear downward trend for the whole period between 2009 and 2017, falling by 0.3 percentage points annually (the linear regression coefficient of determination equals 0.82, which is statistically significant at the 99% level of confidence). It was 6.2% in 2009 and 3.5% in 2017.
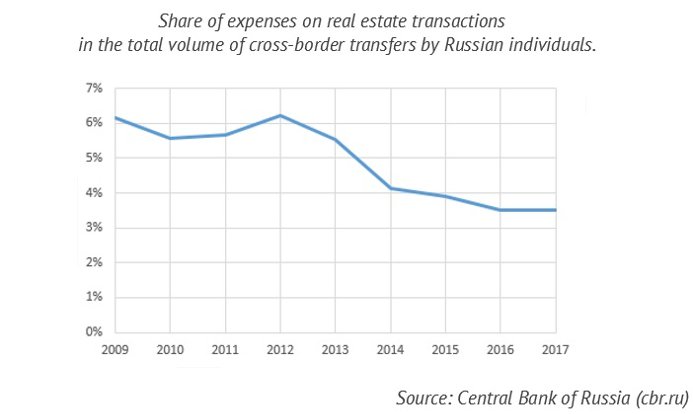
Expenses on real estate transactions occupy a shrinking share of the total volume of cross-border transfers by Russian individuals.
Along with real estate transactions, Central Bank statistics includes other transfers, such as loans, payments for goods and services, and electronic money transfers. Between 2009 and 2017, the shares of transfers for each purpose also shrank. The only exception was “the transfers of own funds” which the Central Bank understands as being “transfers from the accounts of individual residents at authorised banks to the accounts of the same individual residents or their close relatives at non-resident banks and transfers from the accounts of individual residents or their close relatives at non-resident banks to the accounts of the same individual residents at authorised banks”. They amounted to 41% of the total volume transfers made by residents between 2009 and 2017 and grew by 9.1% annually during that period but fell by 2.6 times in 2015 from the year before.
We will send you a content digest not more than once a week